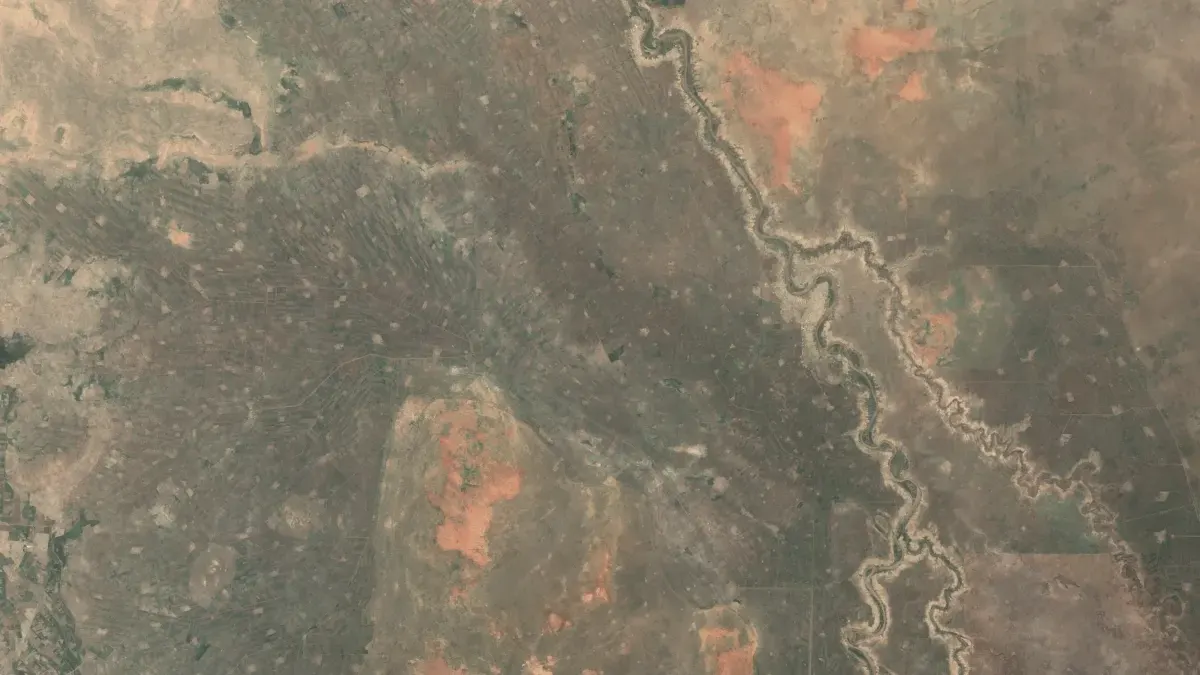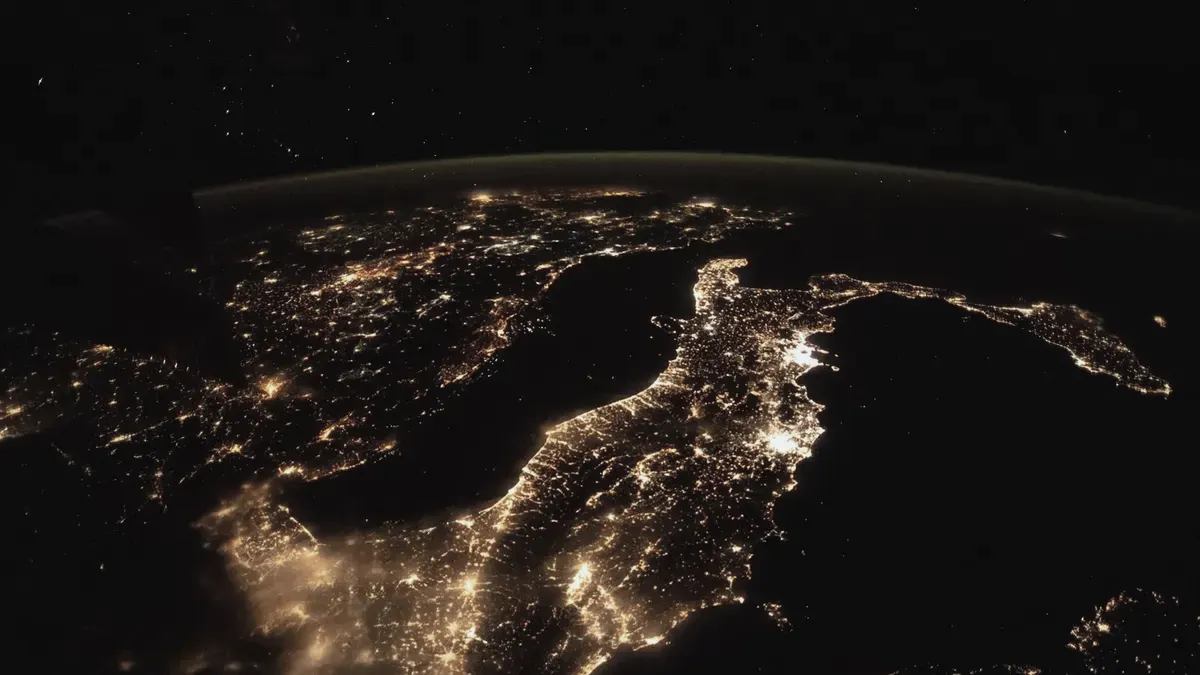
Earth, seen from above.
Satellites pass over every day. We turn what they see into forecasts and measurements people can act on.
Most of the planet is already measured. Few of the measurements reach a decision.
Copernicus and other open archives have imaged the Earth for more than a decade, in radar, light and heat. The data is free. Turning it into something a ministry, an insurer or an engineer can use is the hard part.
We build that part: pipelines that read the archives, models that turn pixels into forecasts and measurements, and a public record of how well they did.
Open satellite archives turned into answers people can act on.
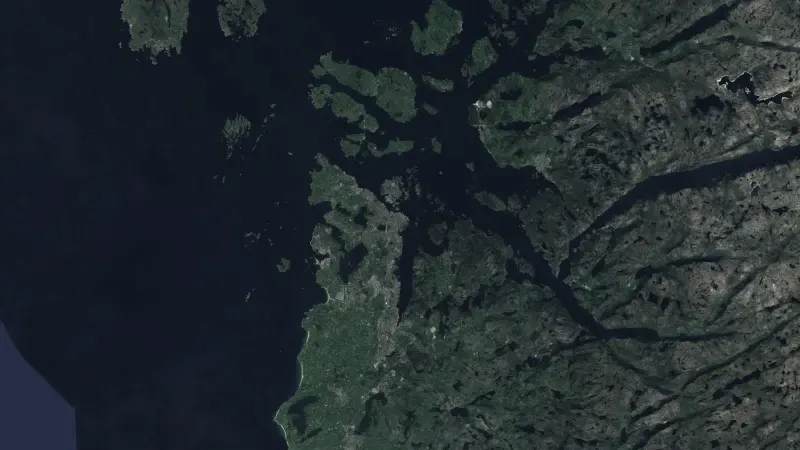
- Food securityWeekly forecasts of food crisis risk, 90 days ahead, for 43 countries.
- Ground motionSee how the ground under a dam, a road or a town moves, measured from radar satellites.
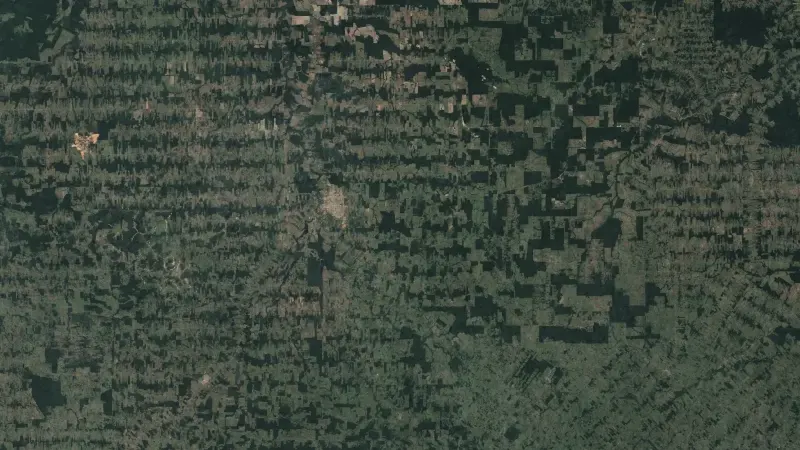
- ForestsFind forest loss and its cause from satellite images, for the EU deforestation regulation.
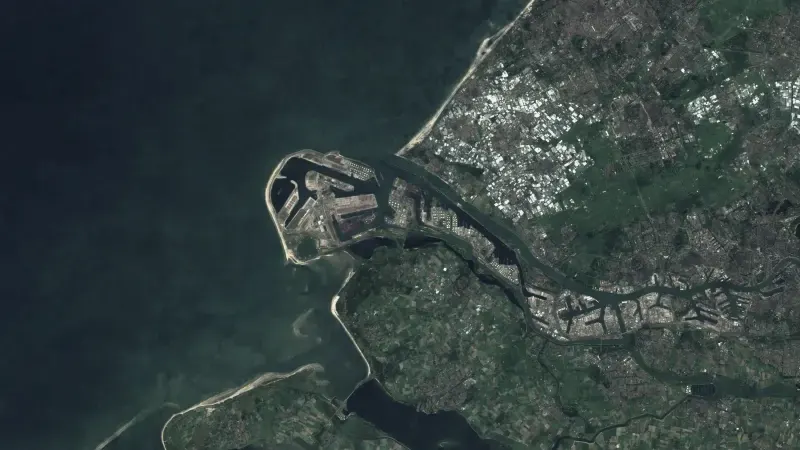
- InfrastructureRadar, optical images and night lights show what changes at ports, plants and at sea.
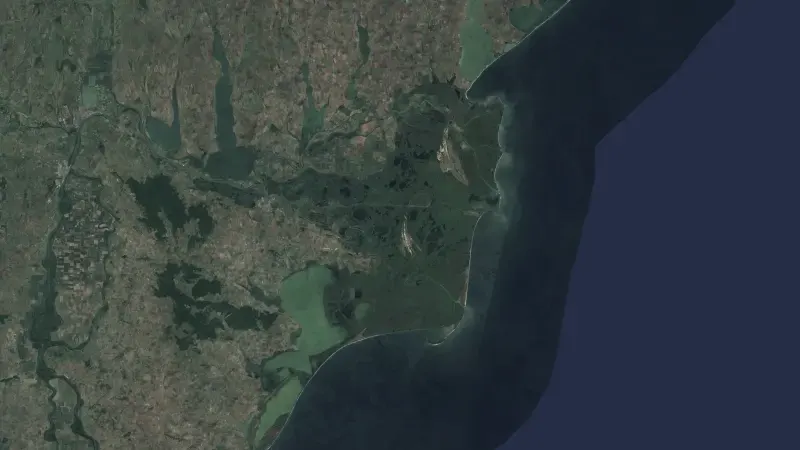
- Data fusionEarth observation data from six sources, aligned and served behind one API.
How we work.
- Read
- We pull from open archives such as Copernicus Sentinel-1 and Sentinel-2, ERA5 and CHIRPS.
- Model
- We turn the pixels into a forecast or a measurement, and publish the method.
- Record
- Every forecast is logged before the outcome and scored after.
Figures.
- 43
- Countries with a forecast every week
- 90 days
- Forecast horizon, scored against what happened
- Open
- Source code for CERES, LITHOS, PSE and climval