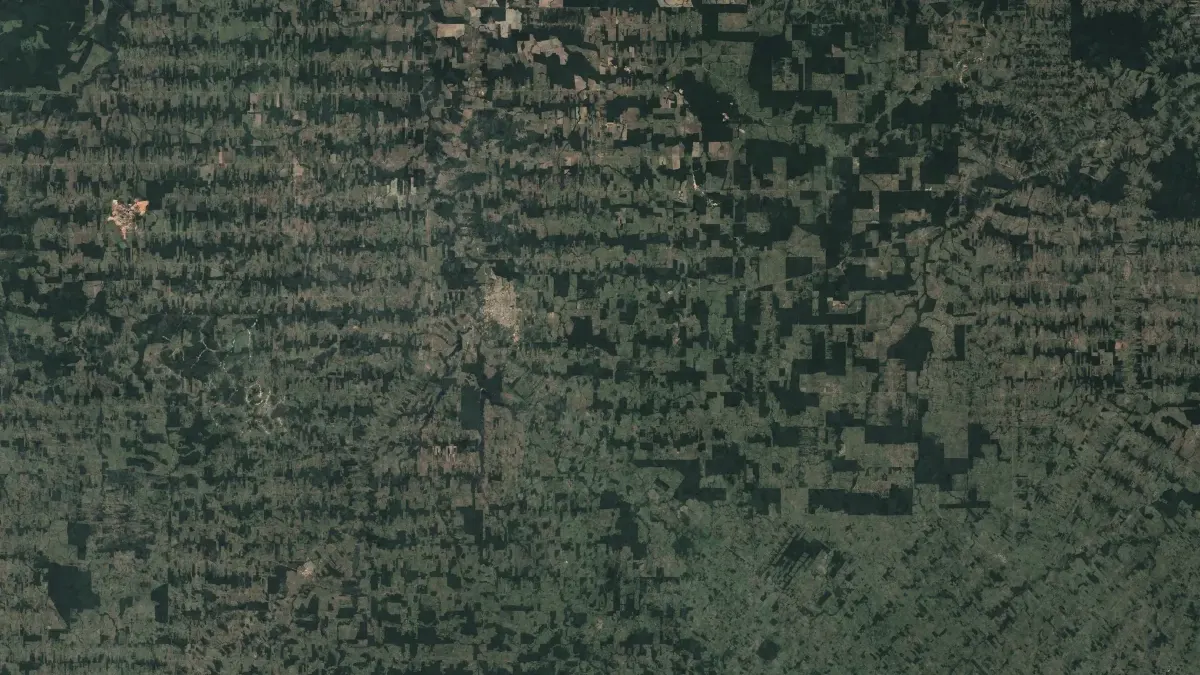
Every hectare accounted for.
Find forest loss and its cause from satellite images, for the EU deforestation regulation.
Under the EU deforestation regulation, a product has to prove where it came from.
Cocoa, coffee, timber, soy and other goods sold in the EU must come from land that was not deforested. Paper declarations are not enough when the forest itself can be seen from orbit.
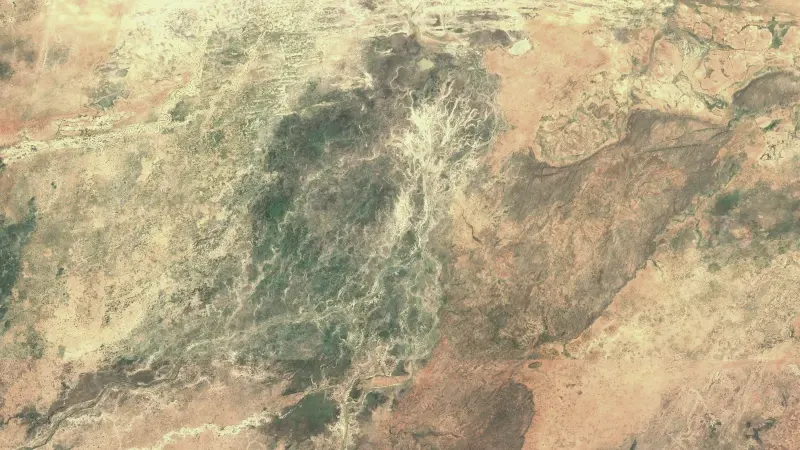
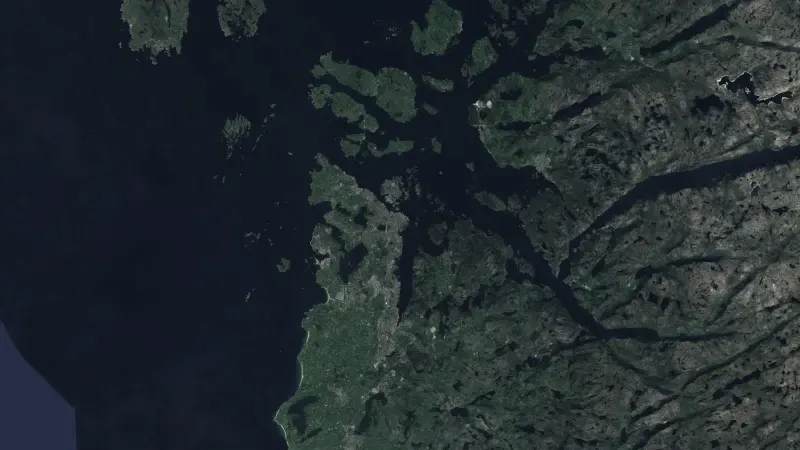
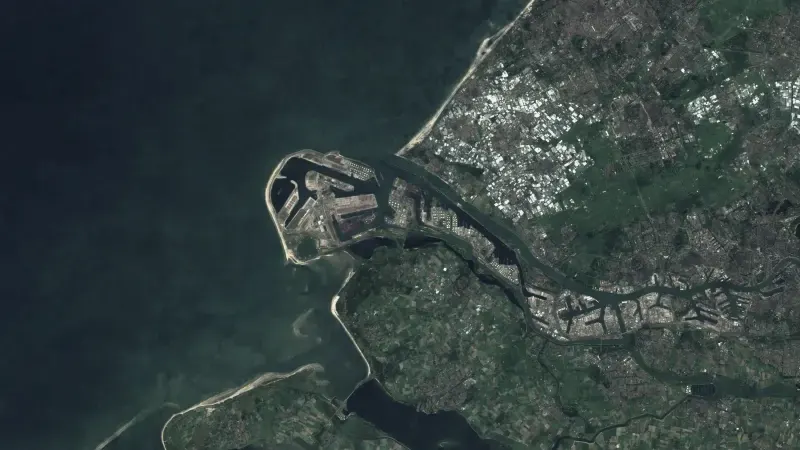
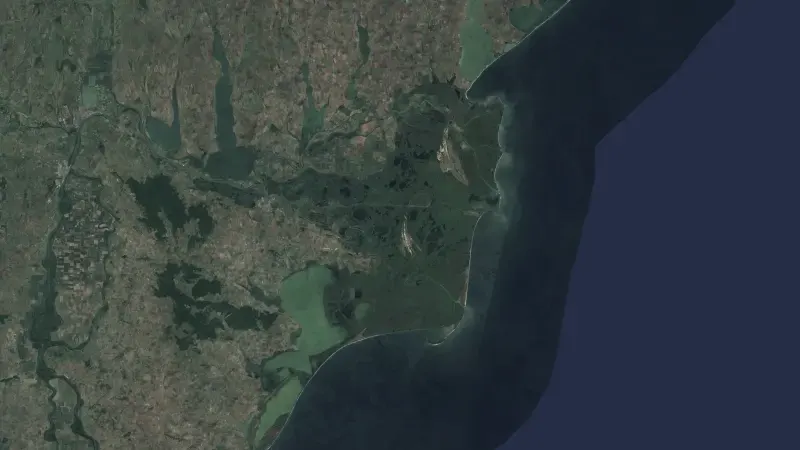
Open Forest Watch reads Sentinel-2 images and deforestation alerts to find where forest was lost and what caused it. It is in development and opens on invitation.
What we deliver.
- Find forest loss on a plot from Sentinel-2 images.
- Combine deforestation alerts from GLAD and RADD into one picture.
- Identify the cause of each loss, not only where it happened.
- Keep the images behind every finding, plot by plot.
How it works.
- Locate
- Plots are placed on the map from their coordinates.
- Compare
- Images and alerts are read across the years that matter.
- Explain
- Every finding comes with its cause and the images behind it.
Behind it.
Satellite and Earth observation
More in this area.
All solutions- Food securityWeekly forecasts of food crisis risk, 90 days ahead, for 43 countries.
- Ground motionSee how the ground under a dam, a road or a town moves, measured from radar satellites.
- InfrastructureRadar, optical images and night lights show what changes at ports, plants and at sea.
- Data fusionEarth observation data from six sources, aligned and served behind one API.