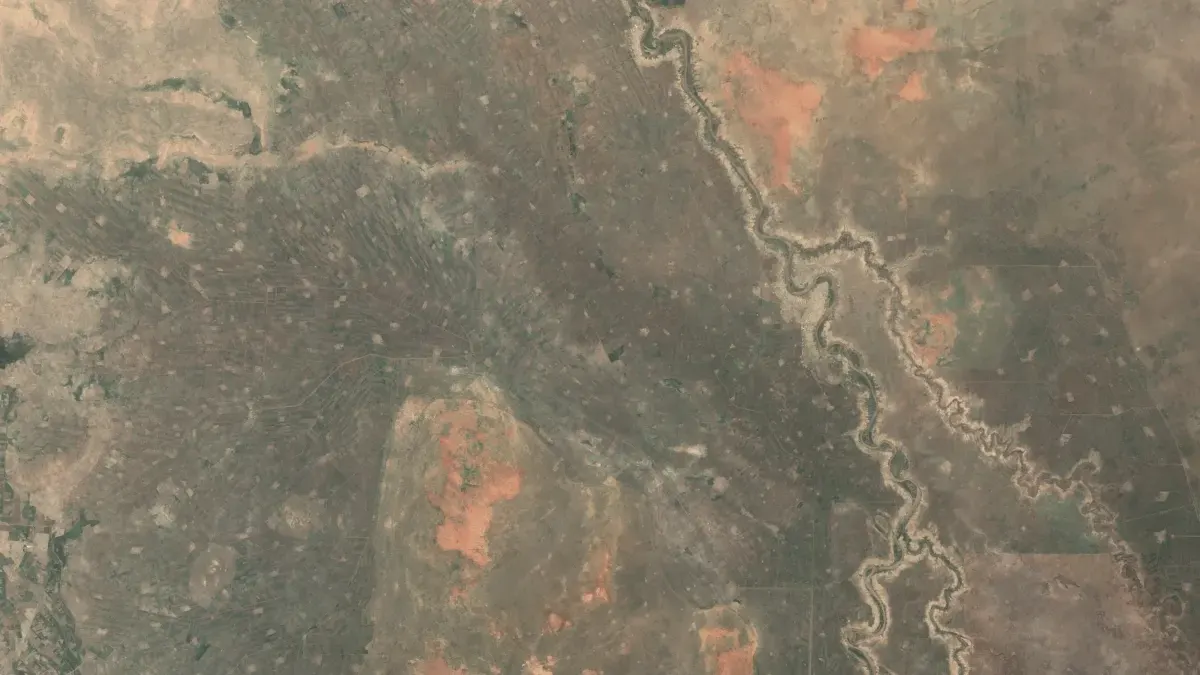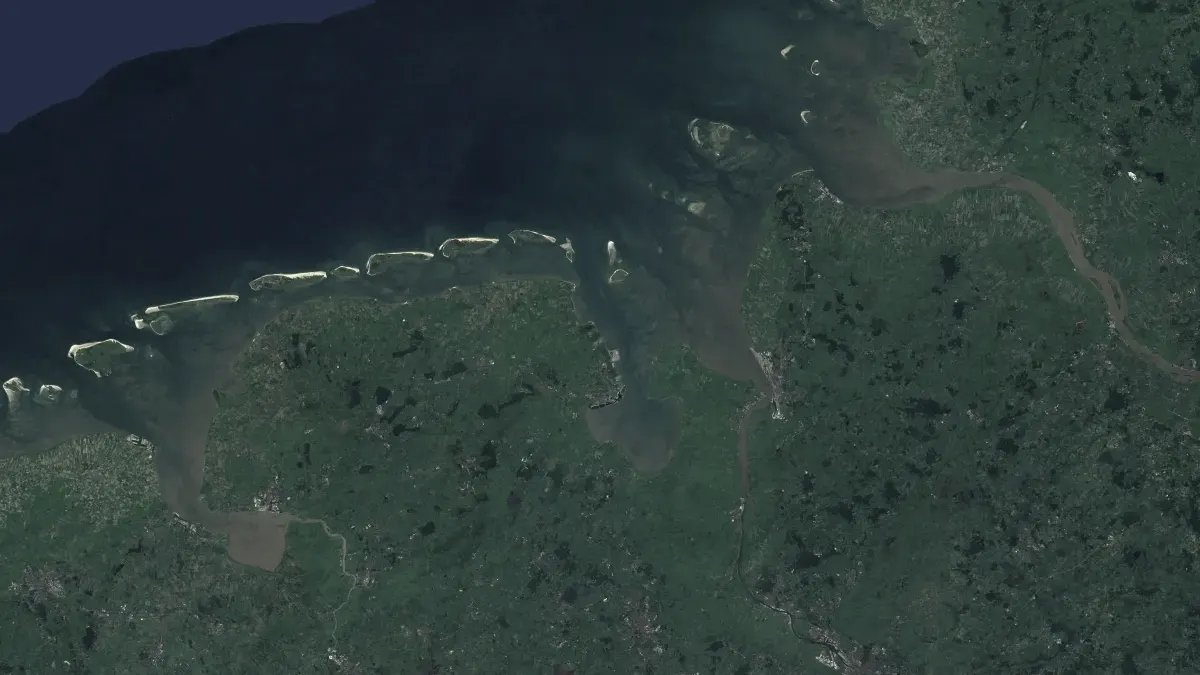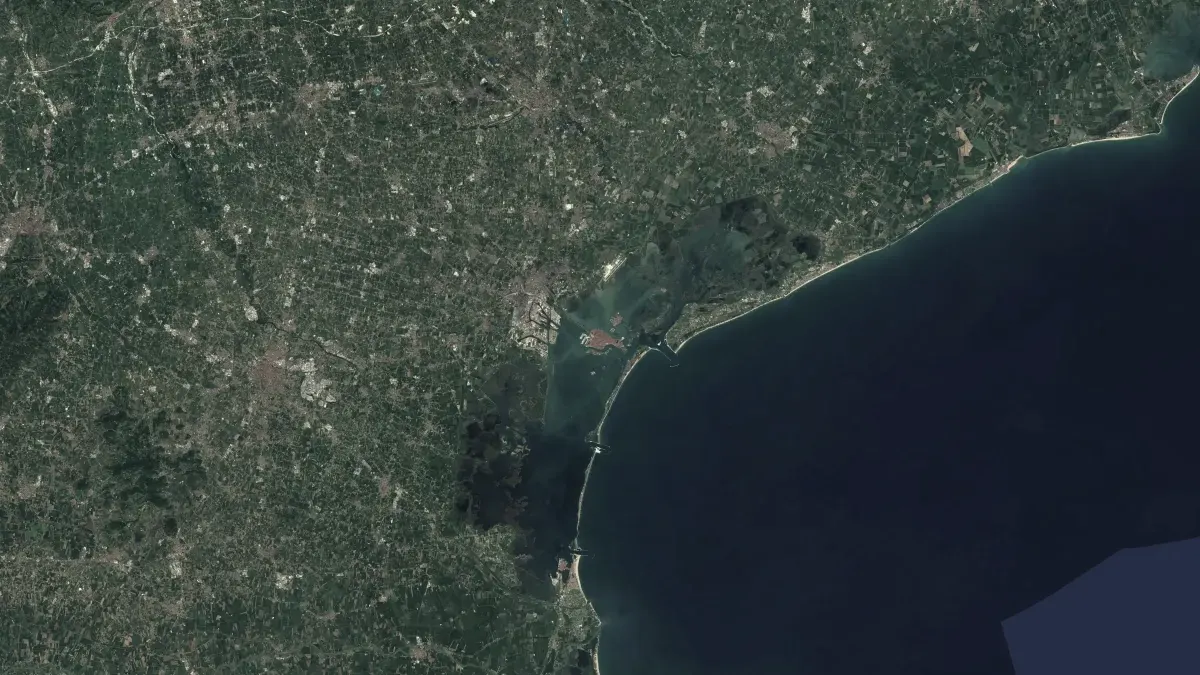
See the ground move.
LITHOS shows how the ground across Europe rises and sinks, to the millimetre, measured by radar satellites. An anomaly engine flags the points where the motion changes.
The ground is never still.
Cities sink as groundwater is drawn down, coastlines subside and dams, railways and buildings deform years before anyone notices. Radar satellites have measured this for more than a decade, and the data is free.
The measurements sit behind specialist tools and large downloads. LITHOS puts them on a map anyone can read and points out what has changed.
How it works.
- Read processed radar data
- LITHOS builds on the European Ground Motion Service from Copernicus and the COMET LiCSAR archive, both measured with radar interferometry.
- Find the change
- Every point is checked for acceleration, a shift in trend and new subsidence forming nearby, with seasonal swings separated from long-term motion.
- Publish the record
- Each flag carries its type, size, onset and confidence, and can be exported or read through an open API.
Figures.
- mm
- Ground motion measured to the millimetre
- Apache 2.0
- Open source licence
Who it serves.
- Engineers and owners of railways, dams and buildings.
- Planners, insurers and geologists assessing ground risk.
- Journalists and researchers checking whether a place is moving.